

HIST23 Glimpse Talk 2026
Step 0 of 0
1
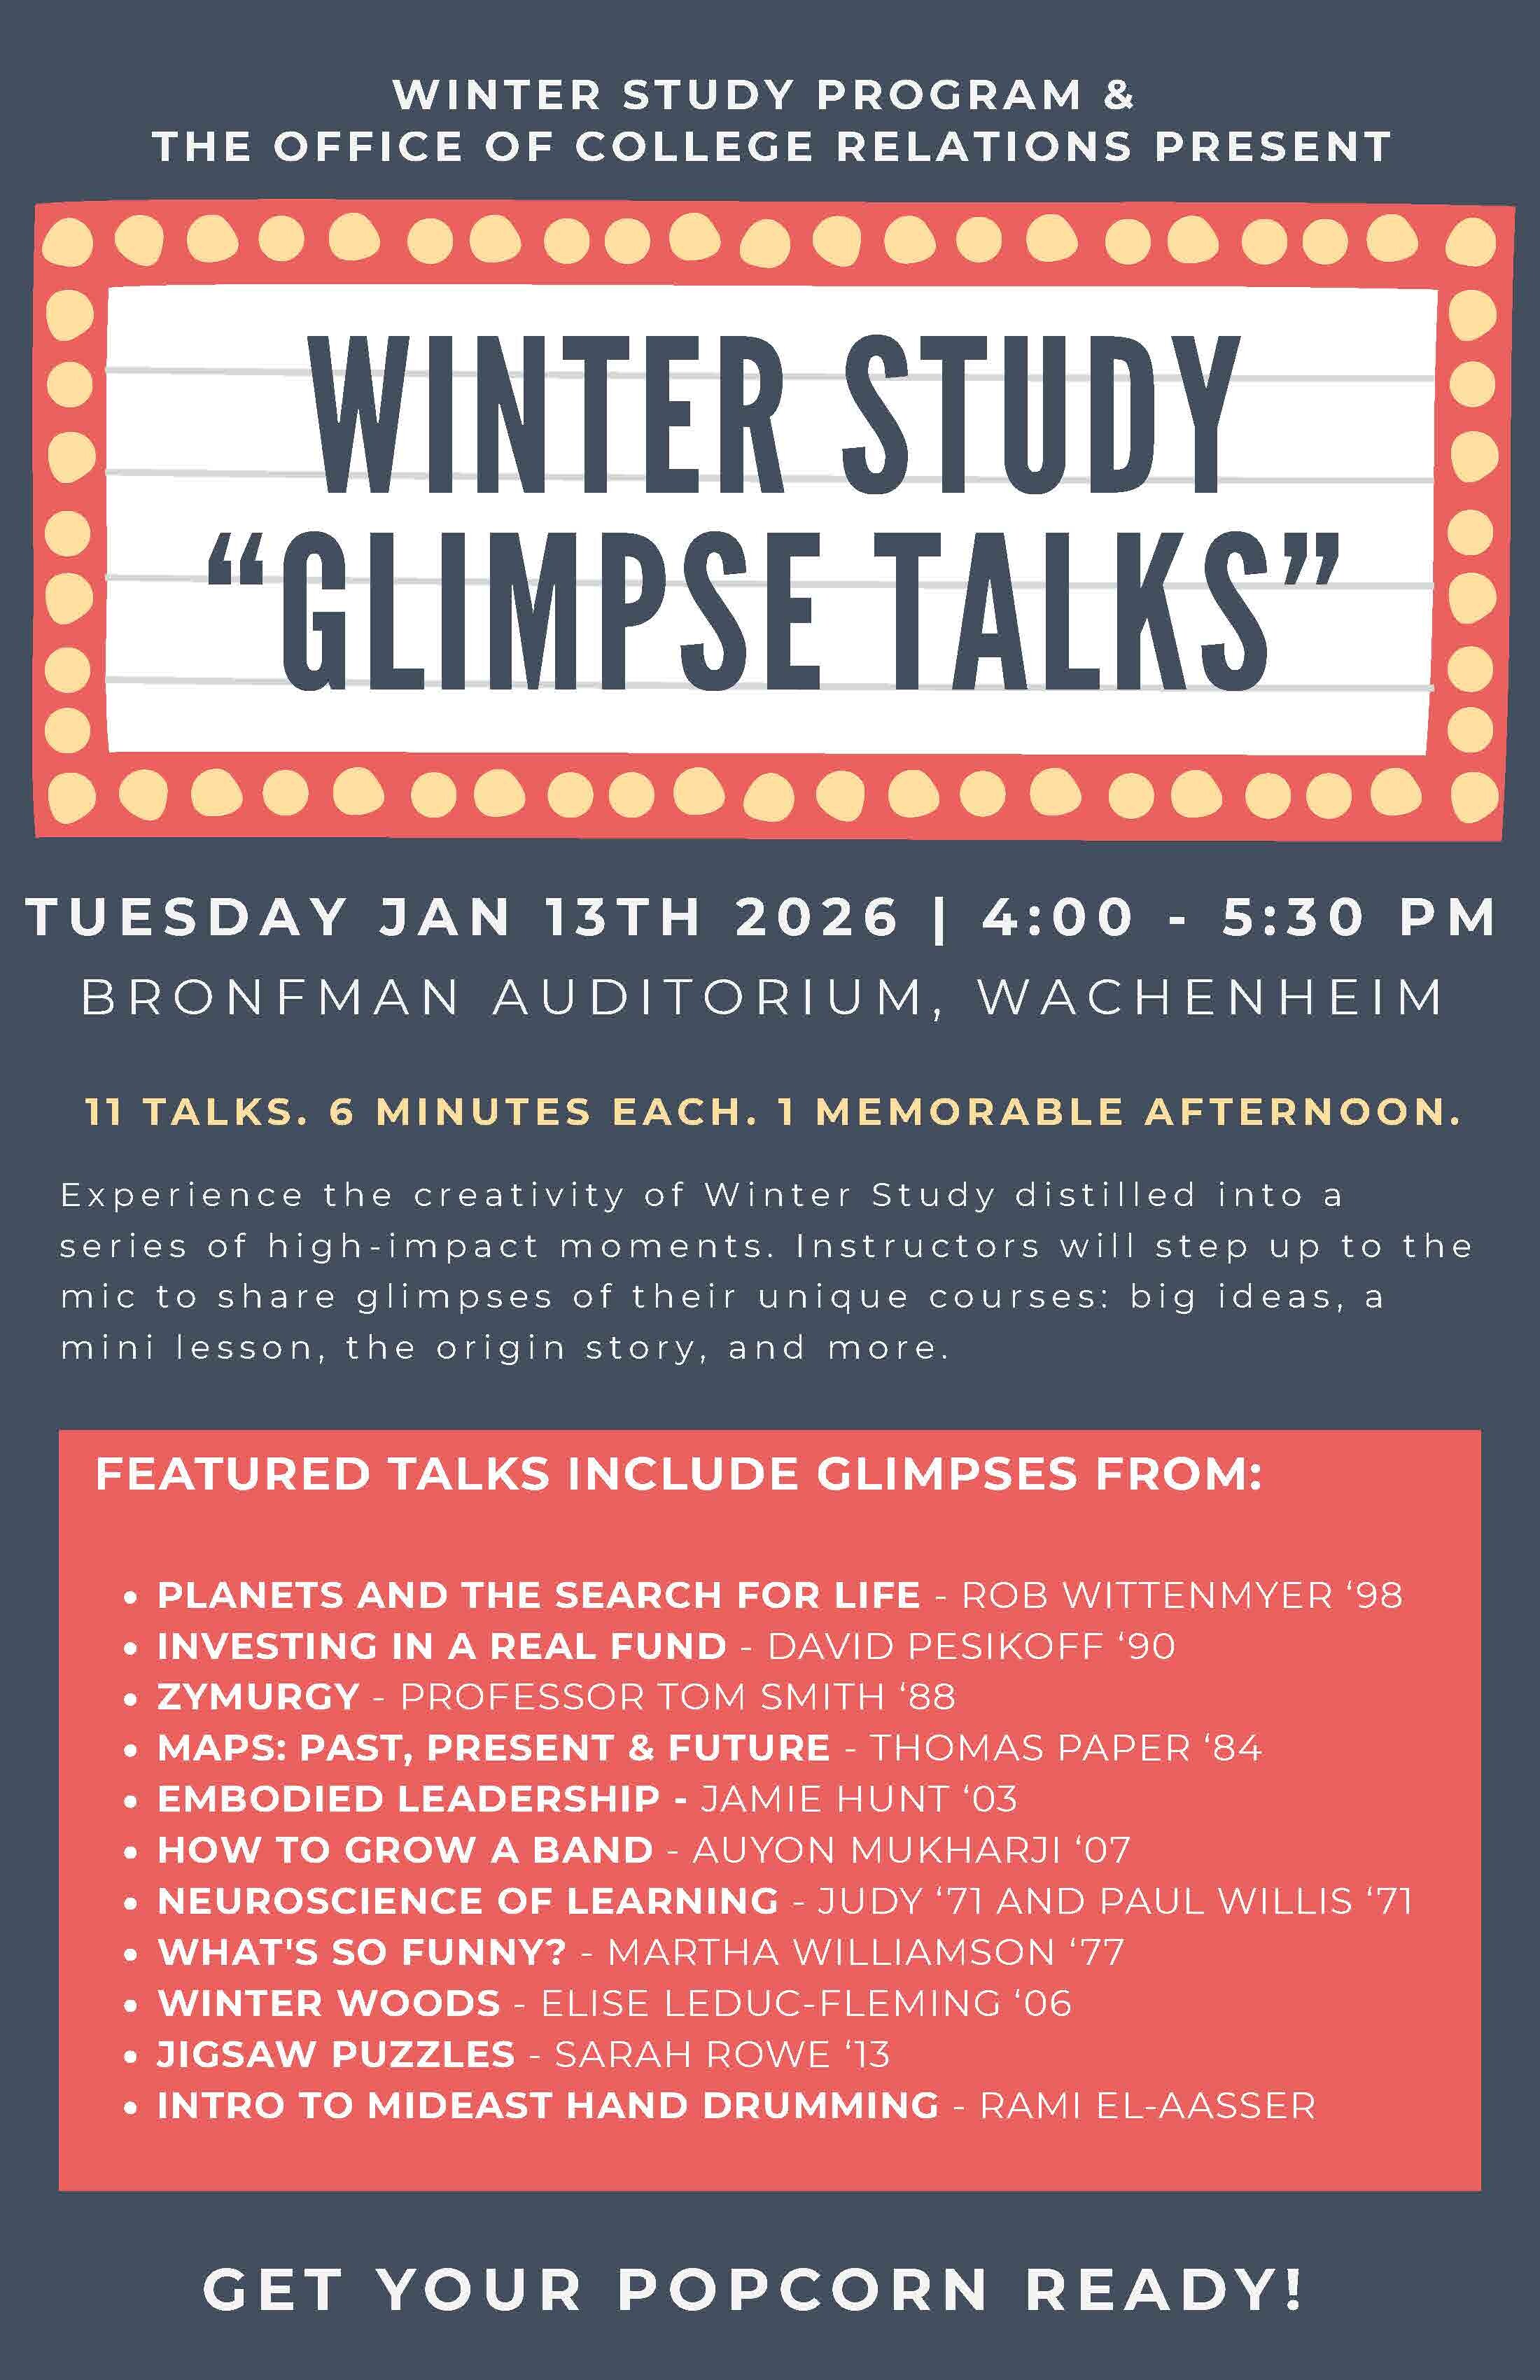
Maps: Past, Present & Future
2

How...
3

A Rainy & Miserable Night
4

A Happy Camper
5
Rob Kent
6
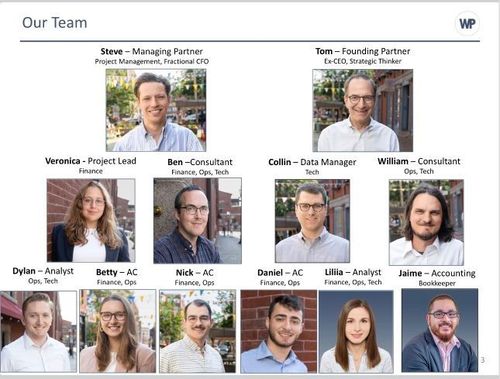
Webster Pacific Team
7
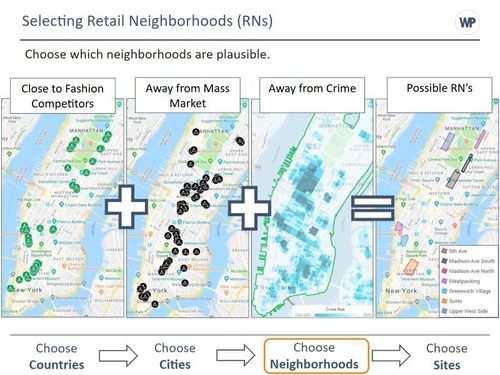
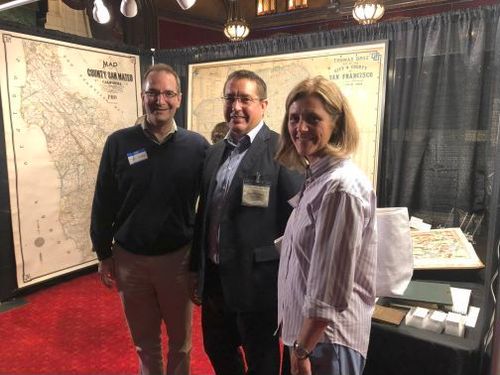
Example of Our Work
8
Discovered Antique Maps
9
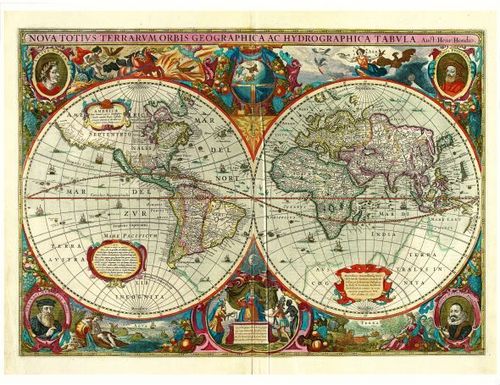
Hendrik Hondius - 1630
10
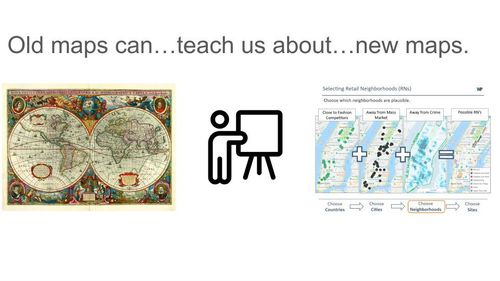
Old Maps Can Teach Us About New Maps
11
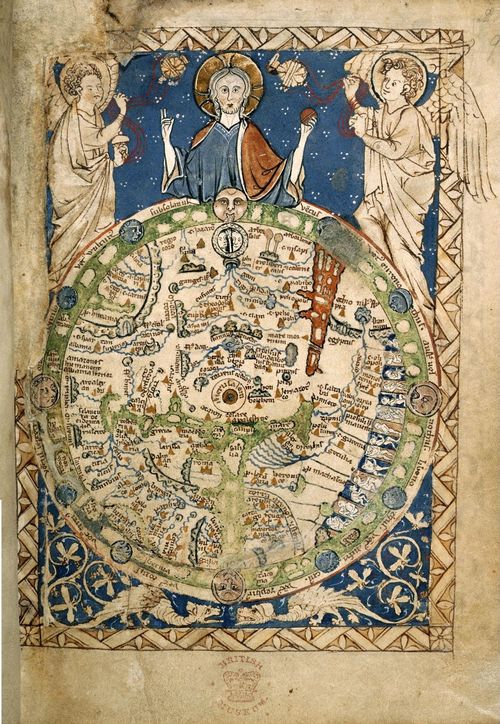
Psalter Map - artist unknown - 1265
12
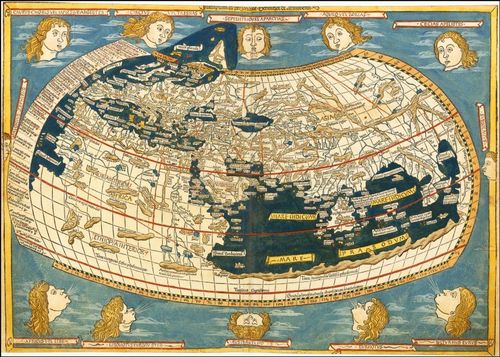
Ulm Ptolemy - 1482
13
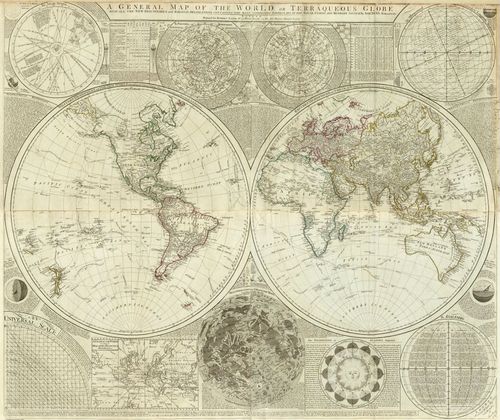
The World - Samuel Dunn - 1787
14
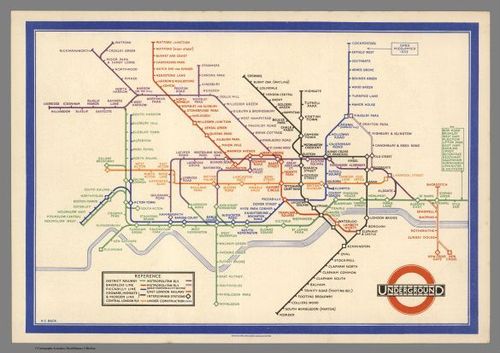
London Underground - 1933 - Harry Beck
15
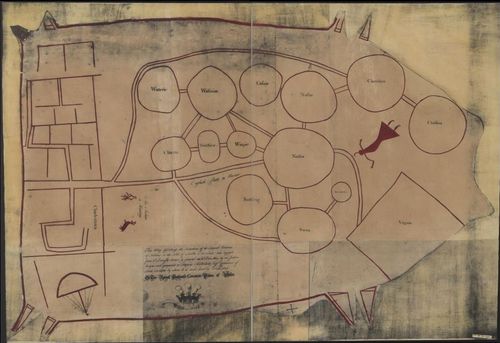
South Carolina Deerskin Map, 1721, Library of Congress Copy.
16
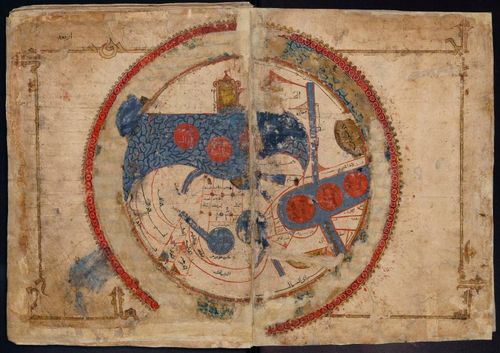
Classic KMMS world map, “Ṣūrat al-Arḍ” (Picture of the World) - 1193
17
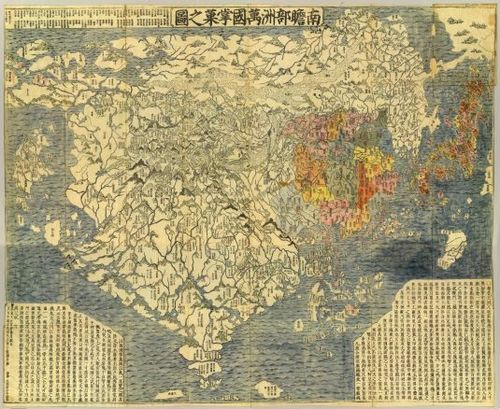
Japanese Buddhist world map, titled Nansenbushu Bankoku Shoka No Zu - 1710
18
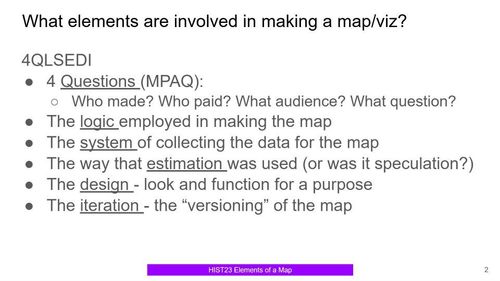
4QLSEDI
19
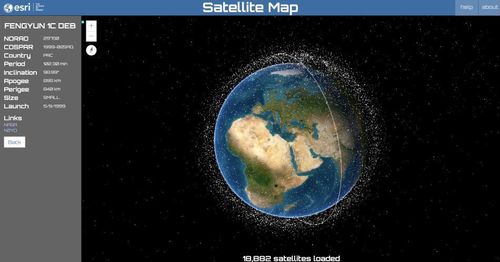
Satellite Map - Jeff Sousa
20
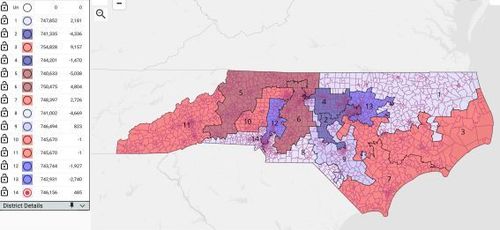
North Carolina Redistricted - Alex Farman-Farmaian
21
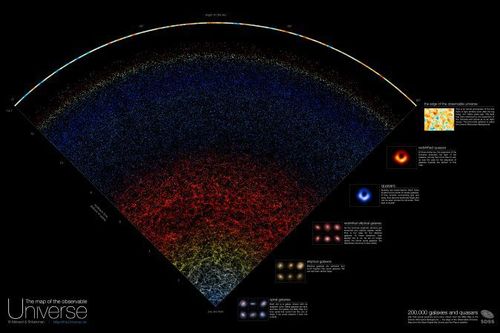
Map of the Universe - Cam Maguire
22
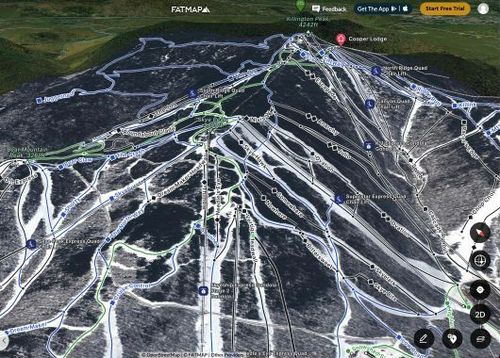
FATMAP - Sam Wexler
23
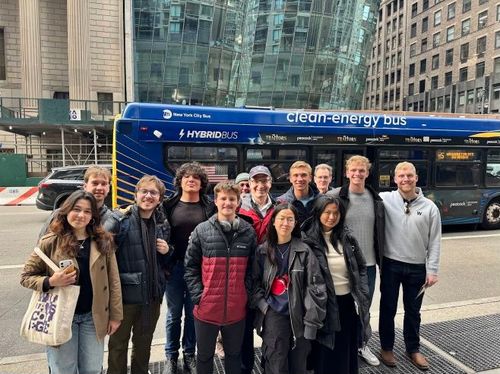
NYC Field Trip - On Subway
24
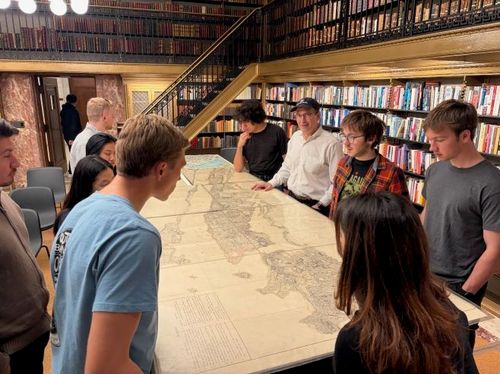
NYC Field Trip - NYPL
25
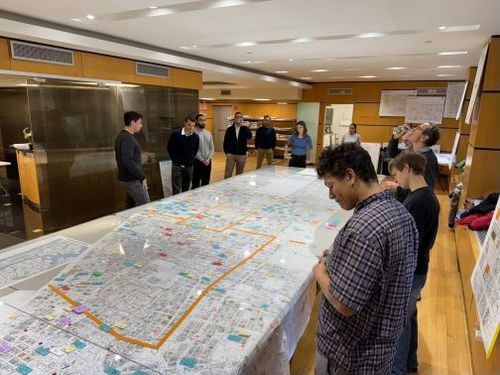
NYC Field Trip - BKREA
26
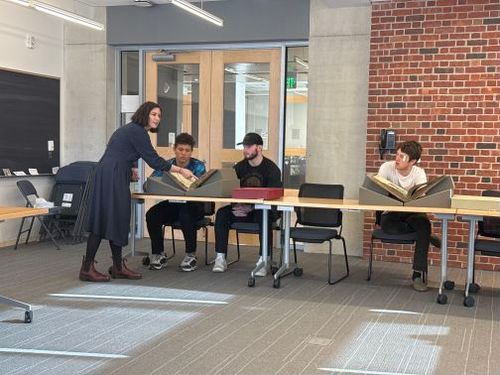
Special Collections - January 2025 - #1
27
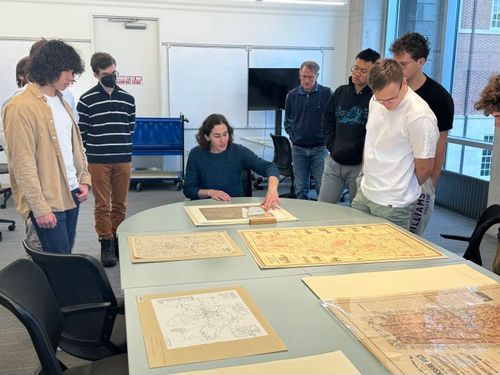
Special Collections - January 2024 - #1
28
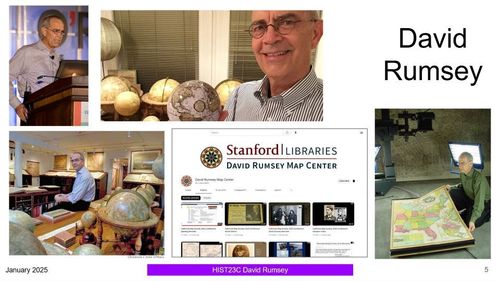
David Rumsey
29
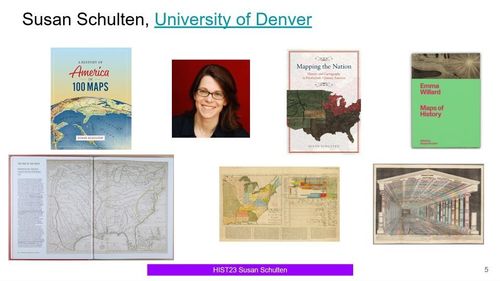
Susan Schulten
30
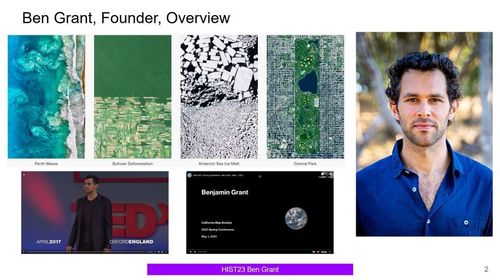
Ben Grant
31
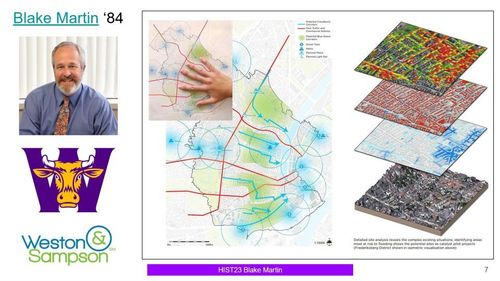
Blake Martin
32
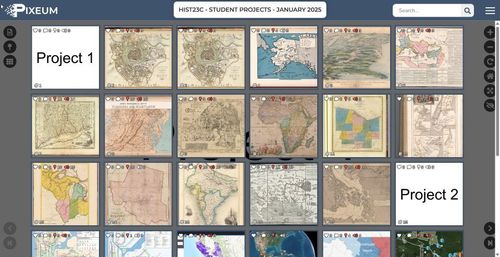
Student Maps - Old Map
33
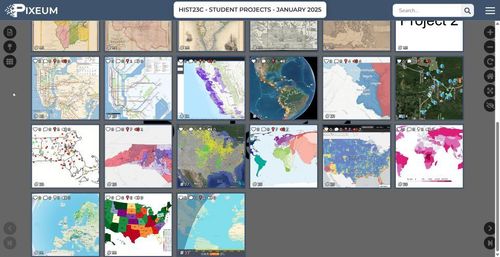
Student Maps - New Map
34

Student Having Coffee With Tom
35
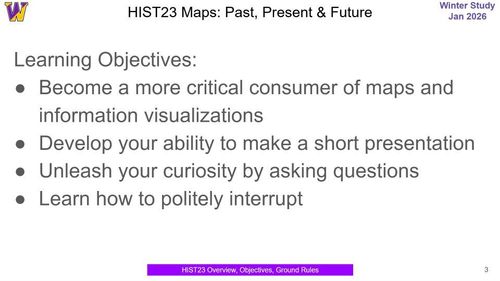
Learning Objectives
36
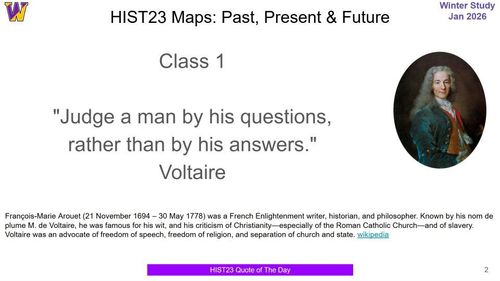
Voltaire
37
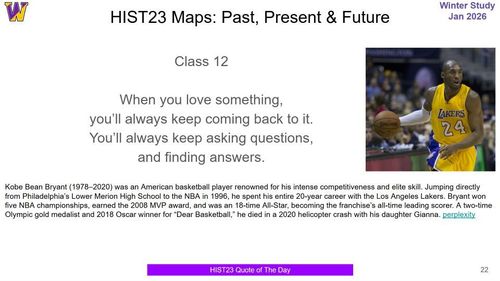
Kobe
38
Thank you!
39
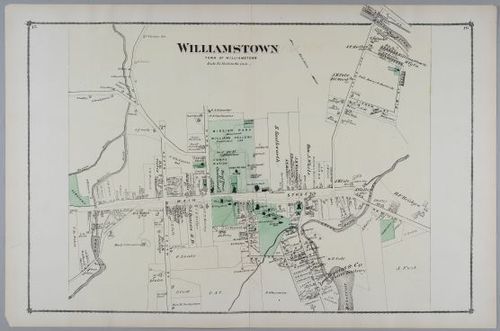
Williamstown - 1876
40
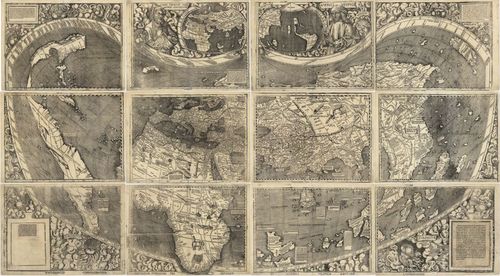
The World - Waldseemueller - 1507
41
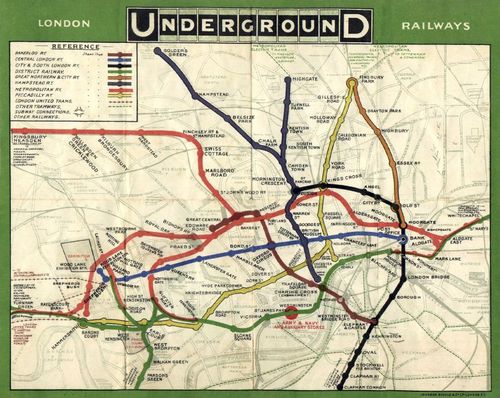
London Underground Map - 1908
Place a DOT on the image