

Chris Hughes exhibit - Summer 2025
Step 0 of 0
1
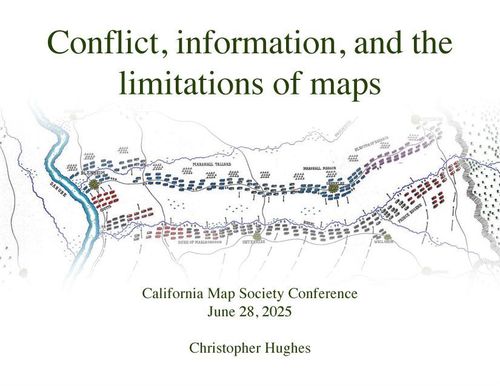
Conflict, Information, and the Limitations of Maps
2

Battle of Blenheim
3
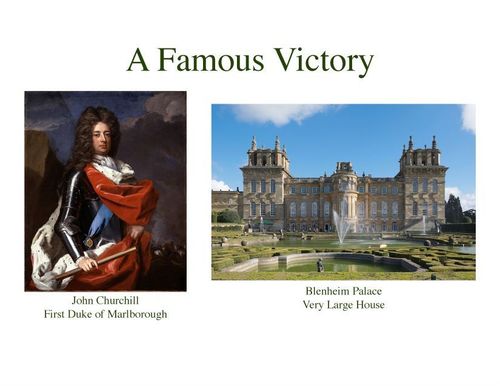
A Famous Victory
4
How clearly?
5
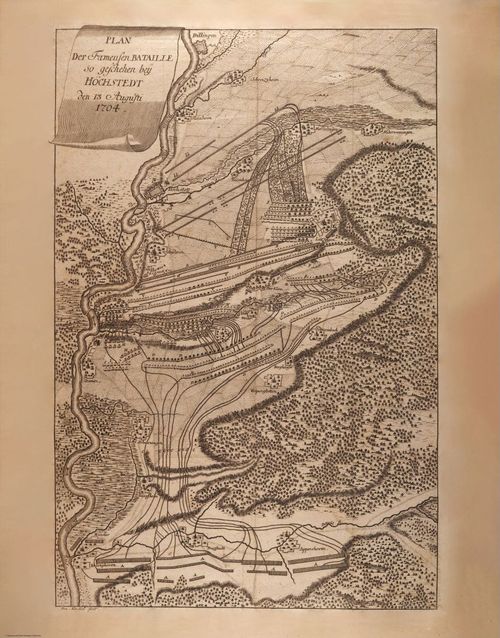
Battle of Blenheim (Again)
6
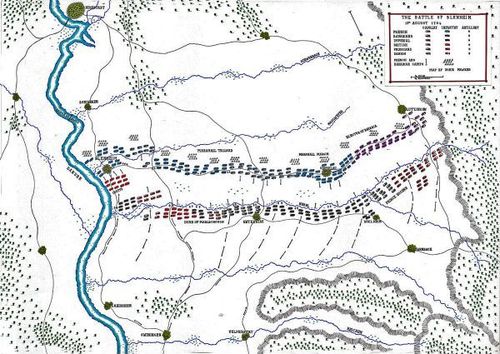
Another Map of the Battle of Blenheim
7
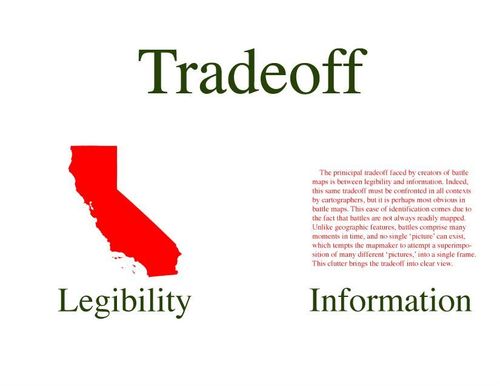
The Tradeoff
8
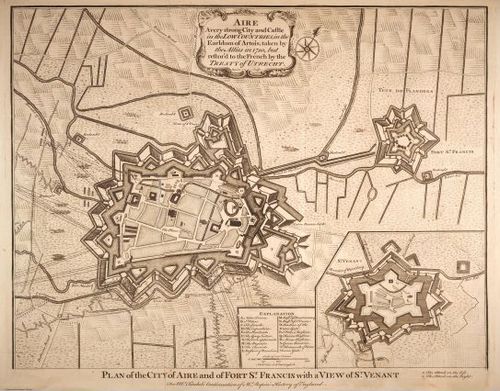
Aire-sur-la-Lys
9
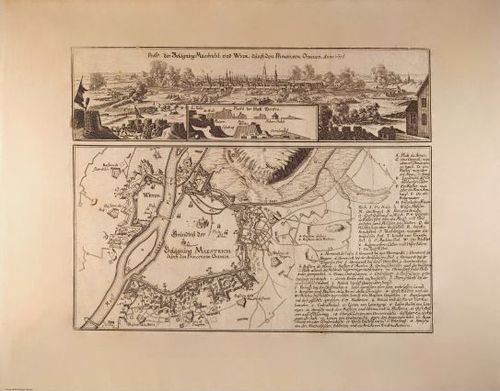
Siege of Maastricht
10
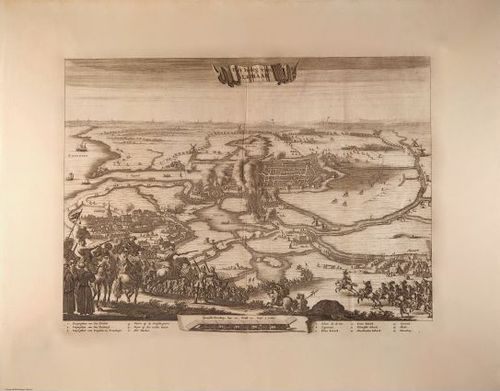
The Siege of Alkmaar (Het Beleg van Alkmaar)
11
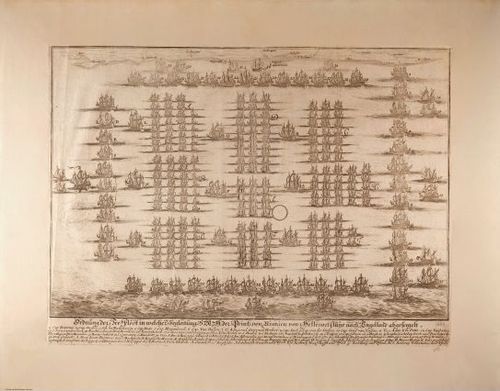
William of Orange crossing the English Channel
12
The Tradeoff?
13
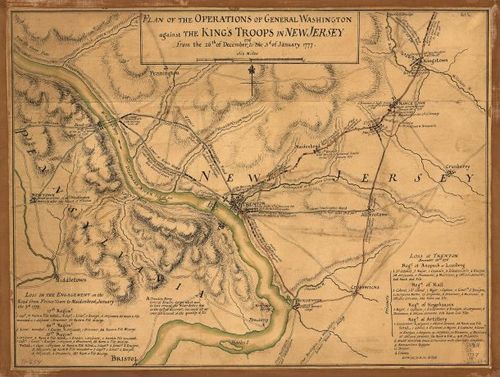
William Faden's 1777 Battle of Trenton Map
14

Getting creative
15
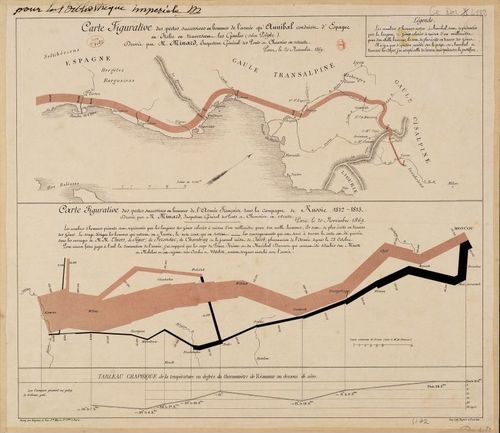
Minard Hannibal and Napoleon
16

Centuries Later
17
Video of the Battle of Blenheim
18
Thank You
19
Acknowledgments
20
![[ 2025-08-13 05:22:44 ]](https://iiif.pixeum.org/iiif/3/1755062579/full/500,/0/default.jpg)
[ 2025-08-13 05:22:44 ]
21
![[ 2025-08-13 05:23:05 ]](https://iiif.pixeum.org/iiif/3/1755062596/full/500,/0/default.jpg)
[ 2025-08-13 05:23:05 ]
22
![[ 2025-08-13 05:23:22 ]](https://iiif.pixeum.org/iiif/3/1755062608/full/500,/0/default.jpg)
[ 2025-08-13 05:23:22 ]
23
![[ 2025-08-13 05:23:29 ]](https://iiif.pixeum.org/iiif/3/1755062617/full/500,/0/default.jpg)
[ 2025-08-13 05:23:29 ]
Place a DOT on the image