

HIST23C - Student Projects - January 2025
Step 0 of 0
1
![[ 2025-01-01 04:39:02 ]](https://iiif.pixeum.org/iiif/3/1735706349/full/500,/0/default.jpg)
[ 2025-01-01 04:39:02 ]
2
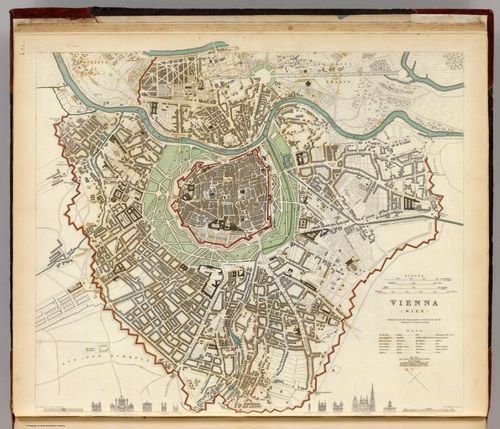
Vienna SDUK - cartographer - 19c - Tom Paper
3

Vienna - cartographer - 17c - Tom Paper
4
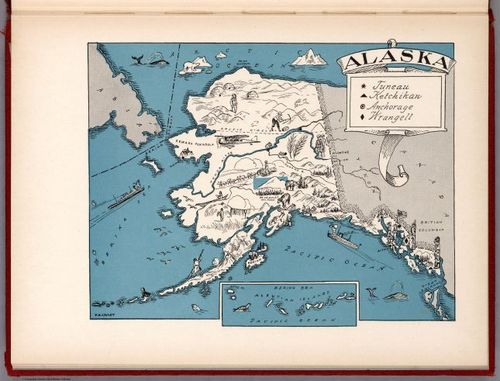
Frederick A. Stokes Company Map of Alaska (1931)
5
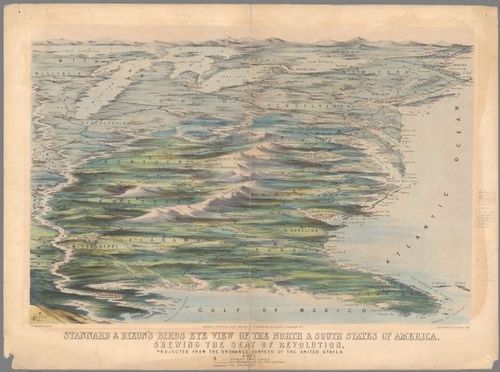
Stannard & Dixon’s Birds Eye View of the North & South States of America - Thomas Packer - 1861 - Christopher Hughes
6
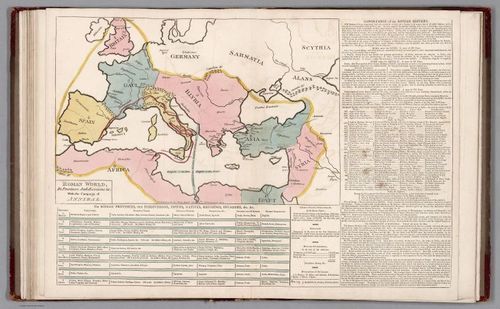
Roman World, its provinces, subdivisions &c. No. 15 - Emmanuel Auguste Dieudonne - 1800 - Alex FF
7
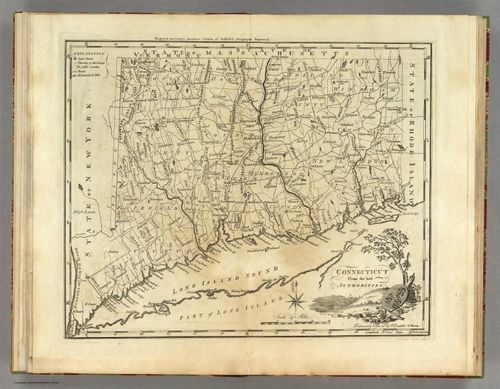
Connecticut, from Carey's General Atlas - Jake Padilla
8
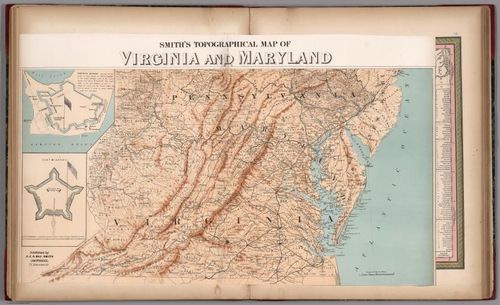
Smith's Topographical Map of Virginia and Maryland - Samuel Augustus Mitchell - 1850 - Wyatt Cotton
9
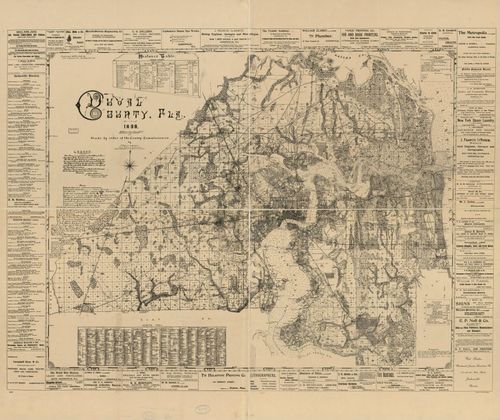
Duval County-J. Francis Le Baron-1898-Ben McGraw
10
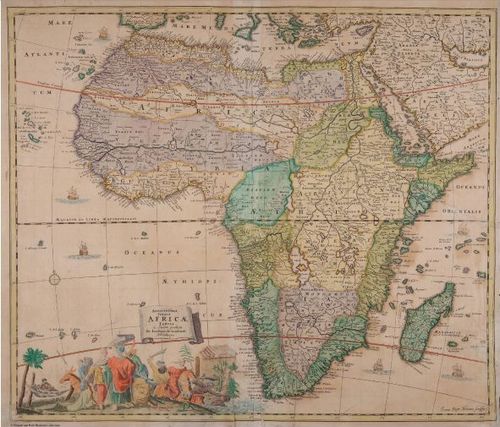
Accuratisima Totius Africa - Jacob von Sandrart - 1697 - Jamie Woods
11
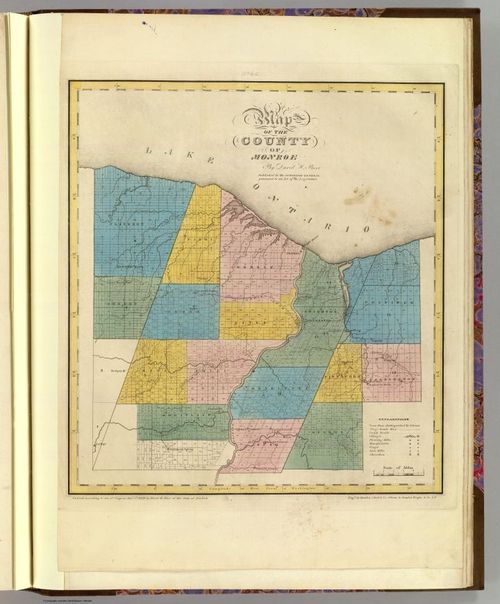
Map of the County of Monroe - David H. Burr - 1829 - Nathan Rodi
12
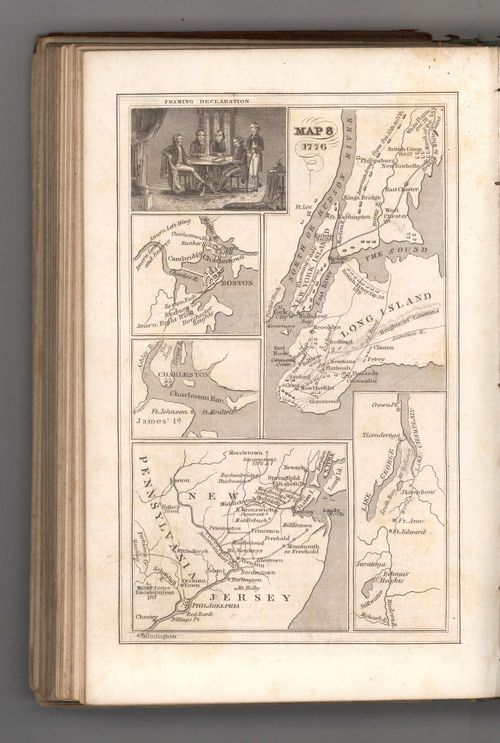
Map 8. 1776 - Emma Willard - 1842 - Lucy Everett
13
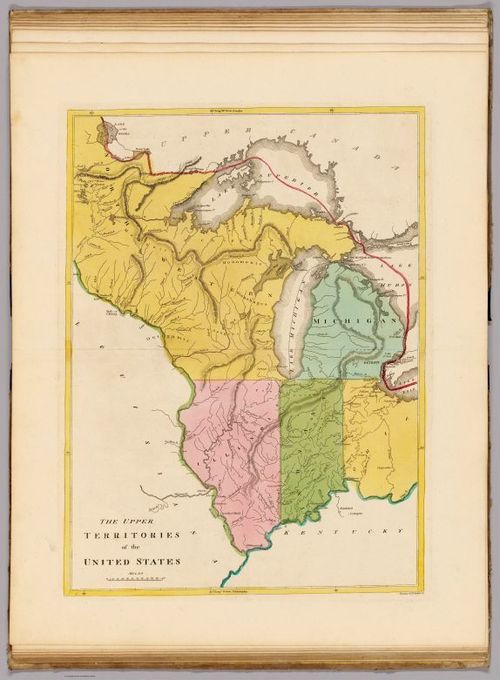
Upper Territories of the United States - Mathew Carey - 1815 - Minnie Pozefsky
14
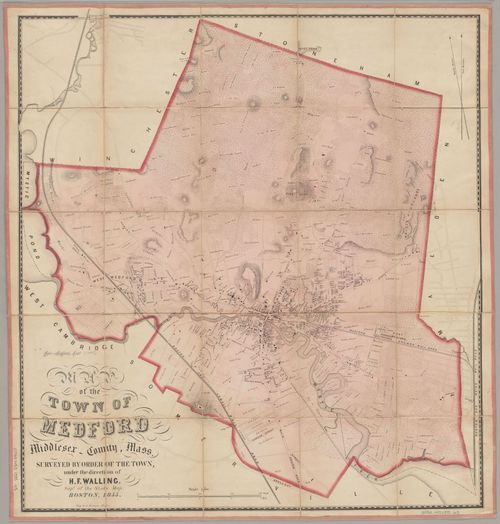
Medford 1855 - Lucy Kossuth
15
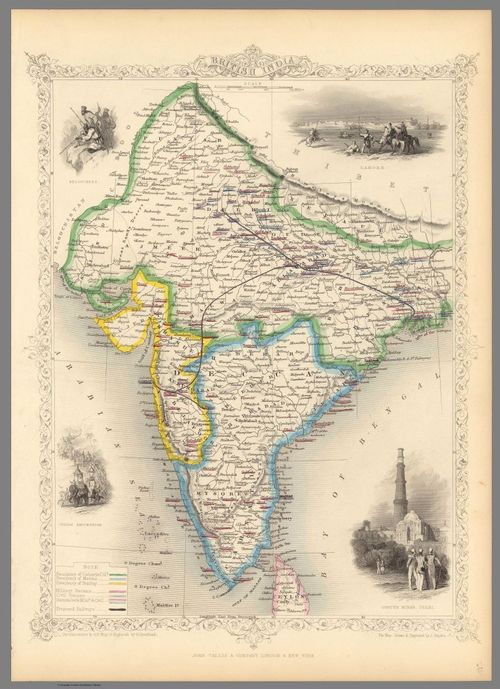
British India - J. Rapkin - 1851 - Zainab Saleem
16
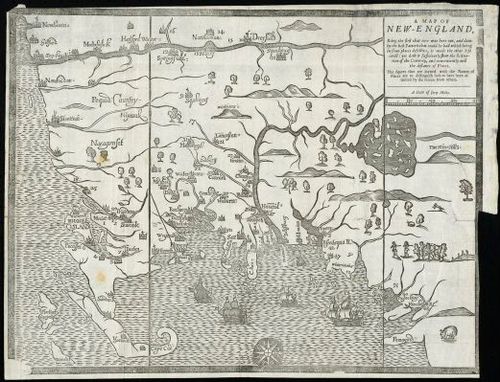
A Map of New England - John Foster - 1677 - Kate Keenan
17
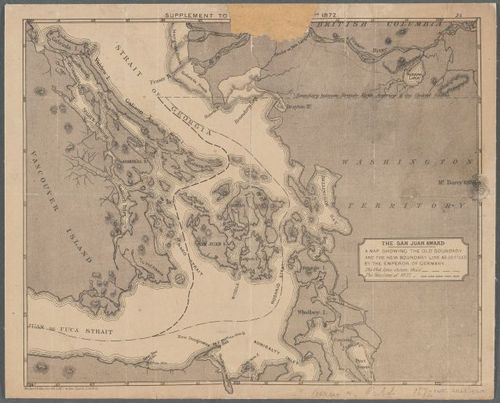
San Juan Islands - Maclure - 1872 - Aidan
18
![[ 2025-01-01 04:38:50 ]](https://iiif.pixeum.org/iiif/3/1735706341/full/500,/0/default.jpg)
[ 2025-01-01 04:38:50 ]
19
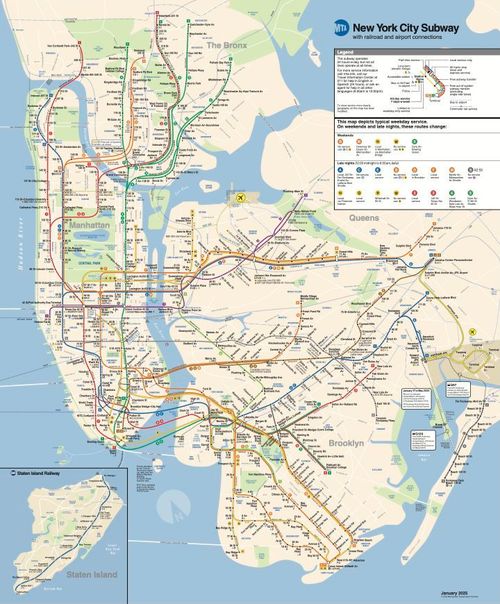
Subway Map, Nobuyuki Siraisi, 2025, Lucy Everett
20
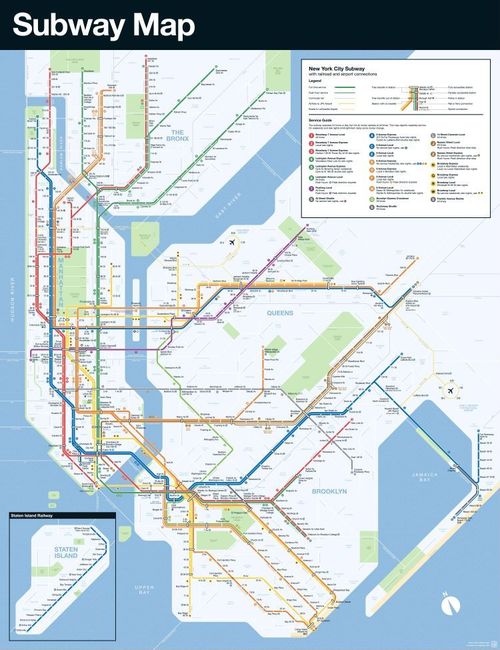
NYC Subway Map 2025
21
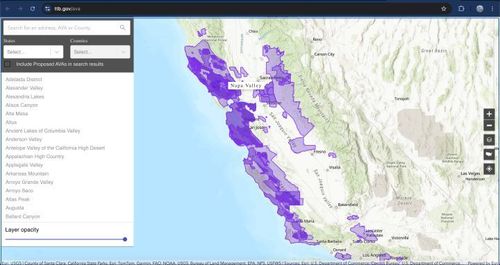
American Viticultural Areas map - Jake Padilla
22
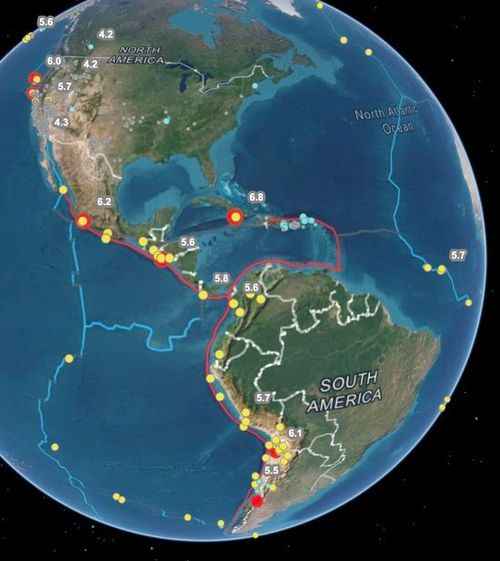
Interactive Earthquake Map- Earthstar Geographics- Ben McGraw
23
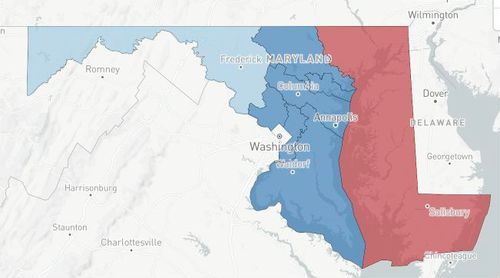
Interactive Gerrymandering Grades - present - Wyatt Cotton
24
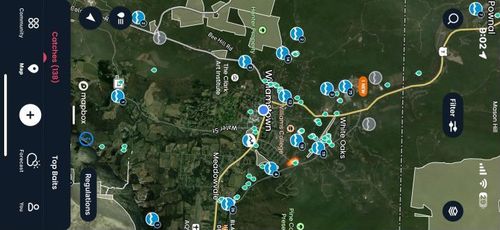
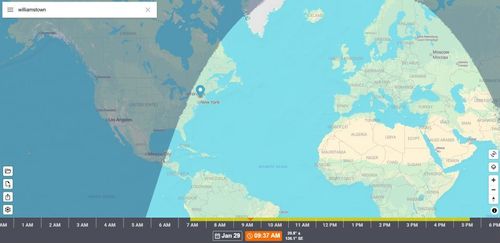
Map of Williamstown Fishing Spots
25
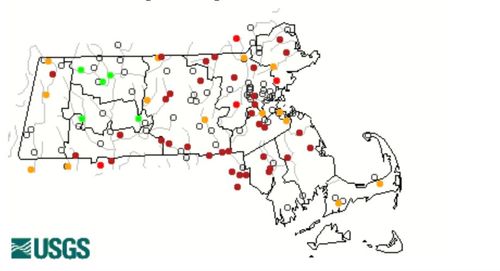
Interactive Map of Mass WAterflow, USGS - January 28, 2025, Logan Valkama
26
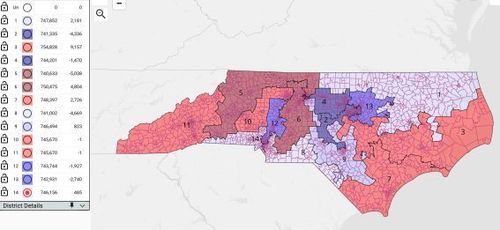
North Carolina Redistricted
27
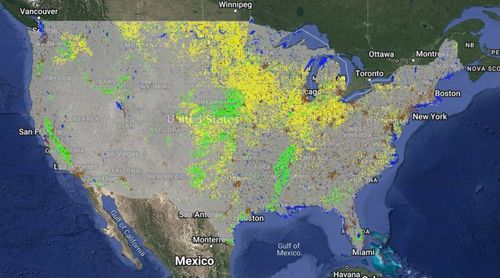
Global Croplands Data - USGS - 2015 - Minnie Pozefsky
28
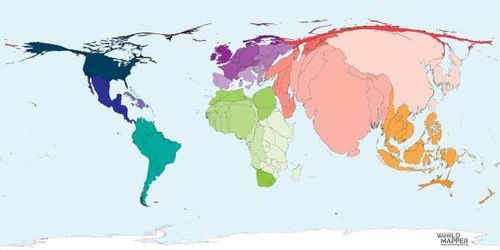
World Map Adjusted for Population Size - Aidan
29
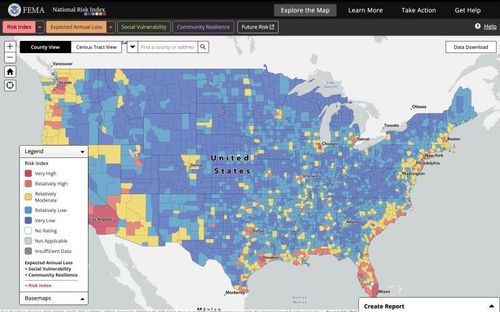
National Risk Index for Natural Hazards - FEMA - Kate
30
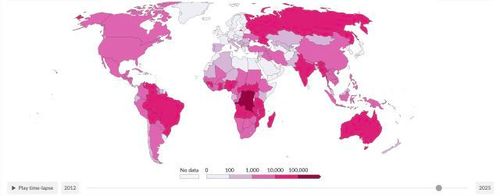
Annual Number of Wildfires - Zainab Saleem
31
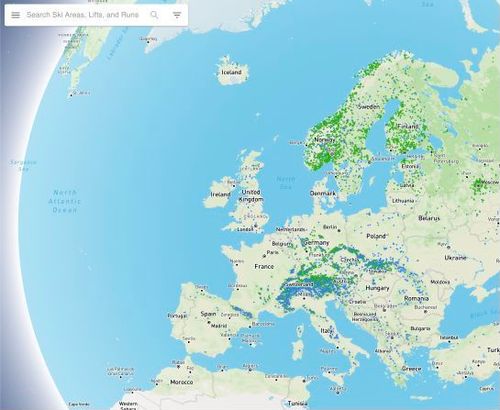
OpenSkiMap - 2025 - Christopher Hughes
32
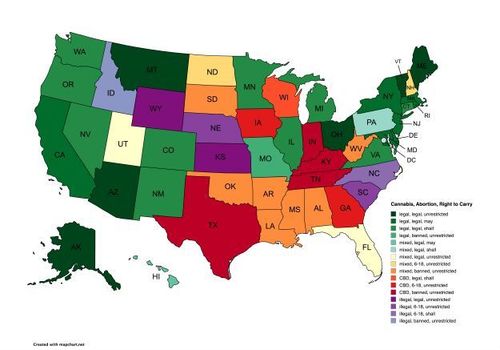
"Where Can I...?" Access to Cannabis, Abortions, and Concealed Carry in the US
33
ShadeMap - Jamie Woods
Place a DOT on the image