

Sample Pixeum Lesson Plan: Life in the Gilded Age
Step 0 of 0
1
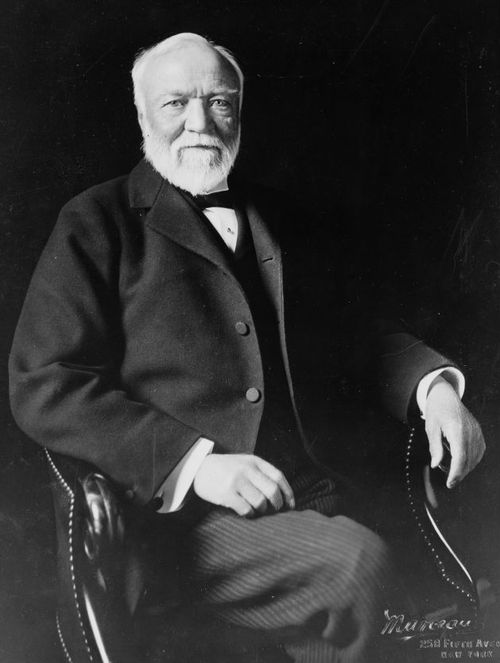
Warm-Up
2
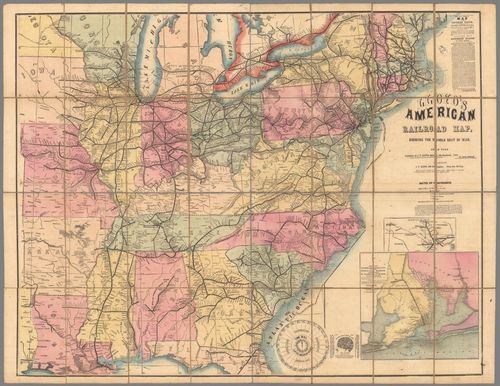
Industry: Pre-Gilded Age Railway Map (1861)
3
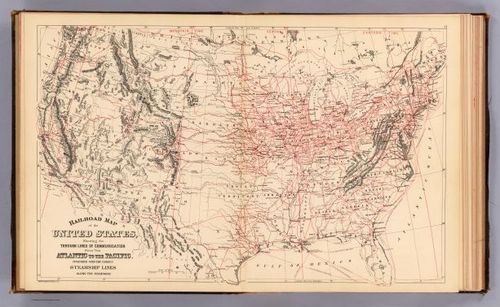
Industry: Late Gilded Age Railroad Map (1890)
4
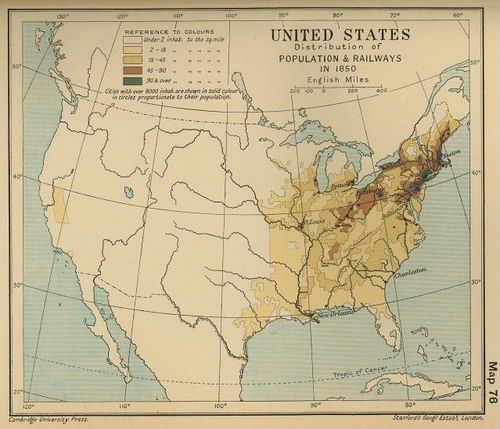
Urbanization: Pre-Gilded Age Population (1850)
5
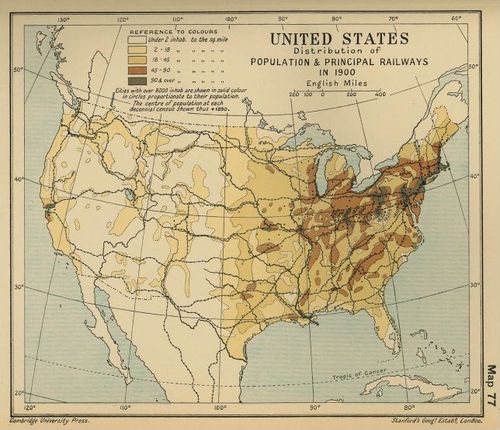
Urbanization: Post-Gilded Age Population (1900)
6
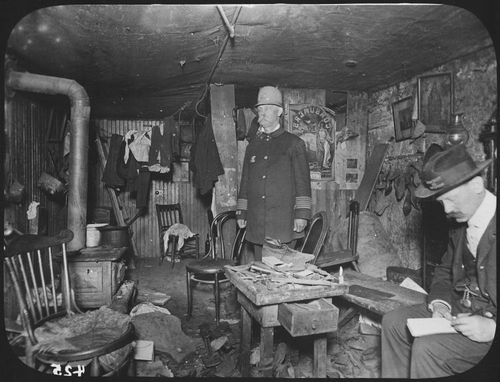
Urbanization: New York City Officials Investigate Housing (1900)
7
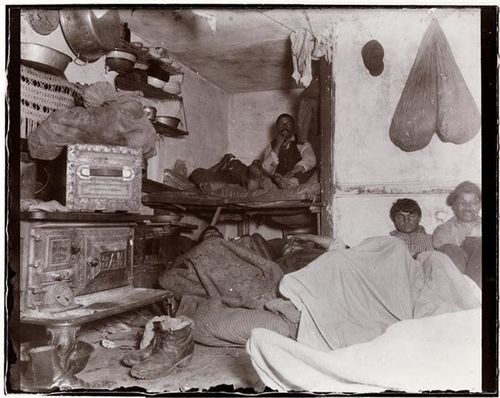
Urbanization: Jacob Riis' Five Cents a Spot (1889)
8
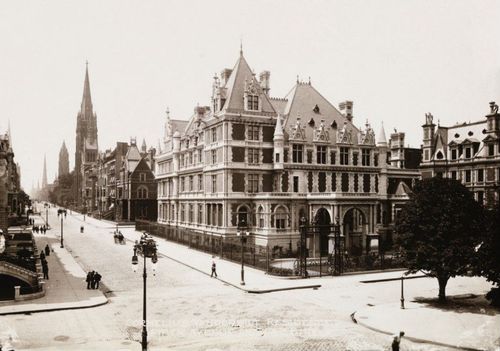
Urbanization: Cornelius Vanderbilt II House (const. 1883)
9
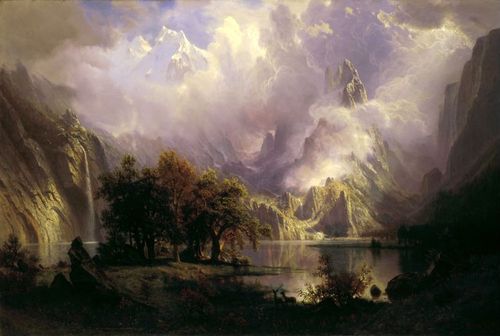
Arts: Albert Bierstadt's Rocky Mountain Landscape (1870)
10
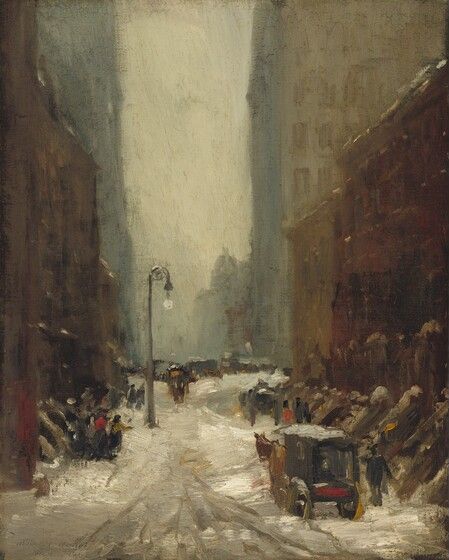
Arts: Robert Henri's Snow in New York (1902)
11
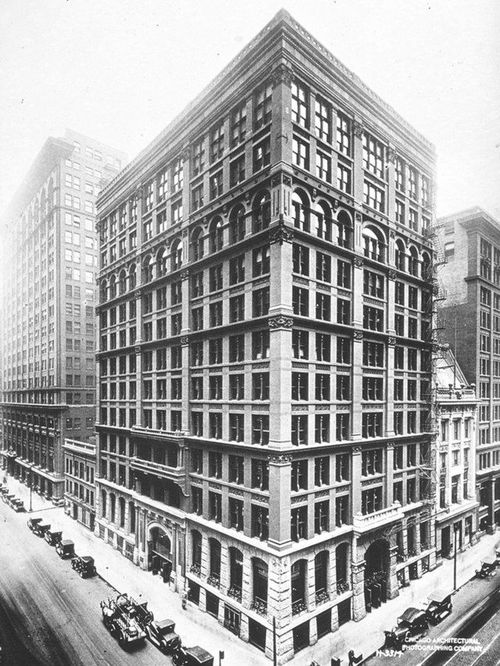
Cities: Home Insurance Building (Chicago, const. 1884)
12
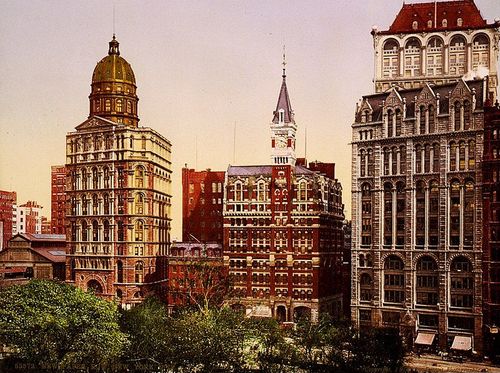
Cities: NYC Newspaper Row (circa 1900)
Place a DOT on the image