

IMCoS Show and Tell 2 - November 30, 2021
Step 0 of 0
1
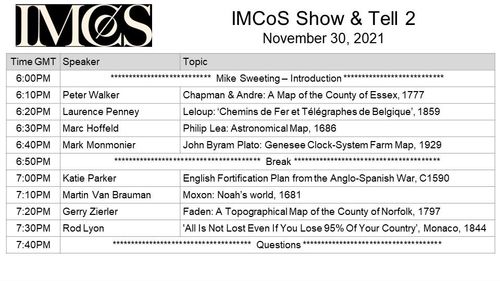
E194 - IMCoS Show & Tell - Intro - November 30, 2021
2

E194 - IMCoS Show & Tell - Peter Walker - November 30, 2021
3
E194 - Peter Walker - Slide 1
4
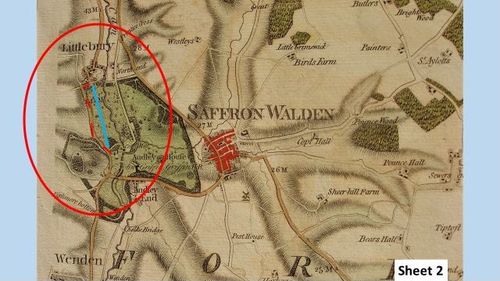
E194 - Peter Walker - Slide 2
5

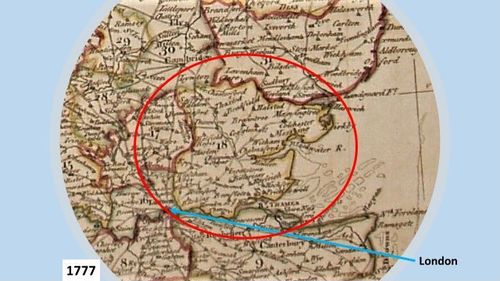
E194 - Peter Walker - Slide 3
6
E194 - Peter Walker - Slide 4
7
E194 - Peter Walker - Slide 5
8
E194 - Peter Walker - Slide 6
9
E194 - Peter Walker - Slide 7
10
E194 - Peter Walker - Slide 8
11
E194 - Peter Walker - Slide 9
12
E194 - Peter Walker - Slide 10
13

E194 - Peter Walker - Slide 11
14

E194 - Peter Walker - Slide 12
15
E194 - Peter Walker - Slide 13
16
E194 - Peter Walker - Slide 14
17
E194 - Peter Walker - Slide 15
18
E194 - Peter Walker - Slide 16
19
E194 - Peter Walker - Slide 17
20

E194 - Peter Walker - Slide 18
21

E194 - Peter Walker - Slide 19
22
E194 - Peter Walker - Slide 20
23
E194 - IMCoS Show & Tell - Laurence Penney - November 30, 2021
24
E194 - Laurence Penney - Slide 1
25
E194 - Laurence Penney - Slide 2
26
E194 - Laurence Penney - Slide 3
27
E194 - Laurence Penney - Slide 4
28
E194 - Laurence Penney - Slide 5
29
E194 - Laurence Penney - Slide 6
30
E194 - Laurence Penney - Slide 7
31
E194 - IMCoS Show & Tell - Marc Hoffeld - November 30, 2021
32
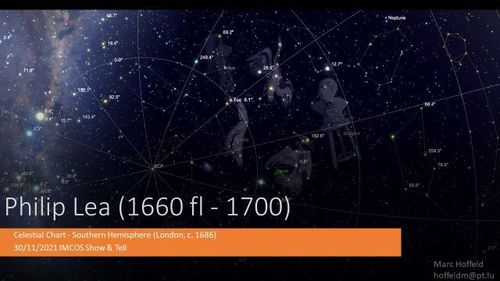
E194 - Marc Hoffeld - Slide 1
33
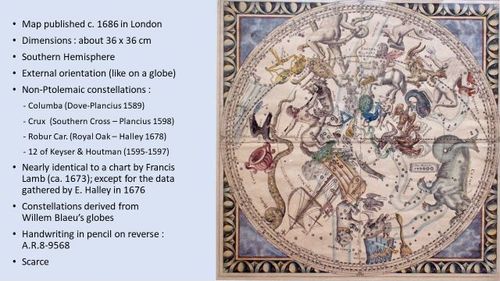
E194 - Marc Hoffeld - Slide 2
34
E194 - Marc Hoffeld - Slide 3
35
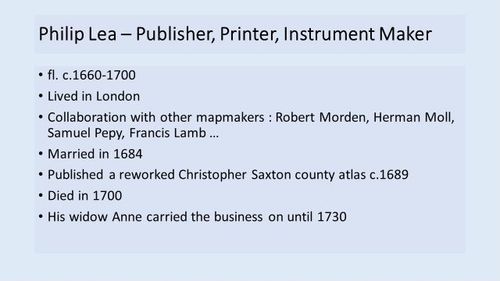
E194 - Marc Hoffeld - Slide 4
36
E194 - Marc Hoffeld - Slide 5
37
E194 - Marc Hoffeld - Slide 6
38
E194 - Marc Hoffeld - Slide 7
39
E194 - Marc Hoffeld - Slide 8
40
E194 - IMCoS Show & Tell - Marc Monmonier - November 30, 2021
41
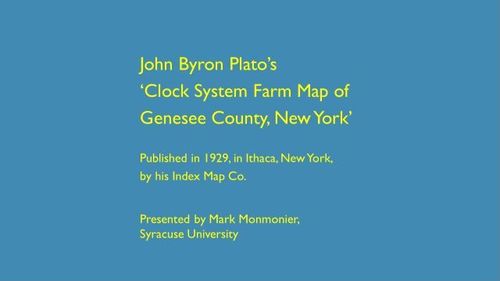
E194 - Mark Monmonier - Slide 1
42
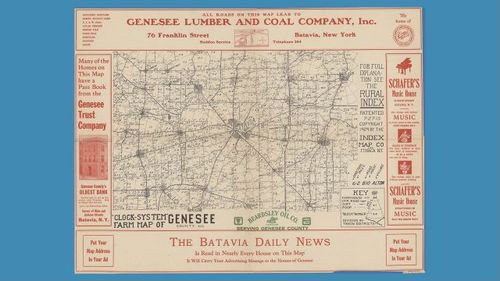
E194 - Mark Monmonier - Slide 2
43
E194 - Mark Monmonier - Slide 3
44
E194 - Mark Monmonier - Slide 4
45
E194 - Mark Monmonier - Slide 5
46
E194 - Mark Monmonier - Slide 6
47
E194 - Mark Monmonier - Slide 7
48
E194 - Mark Monmonier - Slide 8
49
E194 - Mark Monmonier - Slide 9
50
E194 - Mark Monmonier - Slide 10
51
E194 - Mark Monmonier - Slide 11
52
E194 - Mark Monmonier - Slide 12
53

E194 - Mark Monmonier - Slide 13
54

E194 - Mark Monmonier - Slide 14
55
E194 - Mark Monmonier - Slide 15
56
E194 - Mark Monmonier - Slide 16
57
E194 - Mark Monmonier - Slide 17
58

E194 - IMCoS Show & Tell - Katie Parker - November 30, 2021
59

E194 - Katie Parker - Slide 1
60
E194 - IMCoS Show & Tell - Martin Van Brauman - November 30, 2021
61
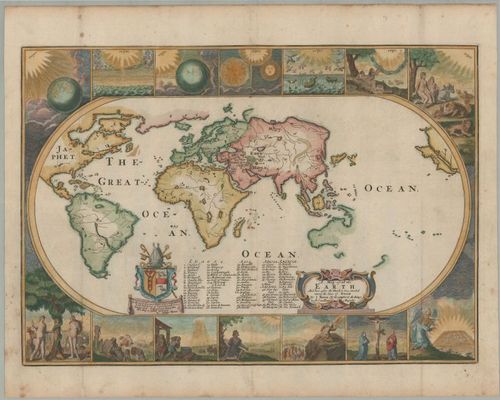
E194 - Martin Van Brauman - Slide 1
62

E194 - IMCoS Show & Tell - Gary Zierler - November 30, 2021
63
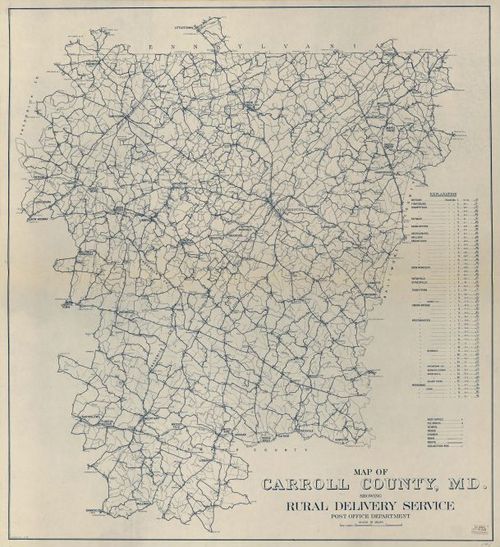
E194 - Gary Zierler - Slide 1
64
E194 - Gary Zierler - Slide 2
65
E194 - Gary Zierler - Slide 3
66
E194 - Gary Zierler - Slide 4
67
E194 - Gary Zierler - Slide 5
68
E194 - Gary Zierler - Slide 6
69
E194 - Gary Zierler - Slide 7
70
E194 - Gary Zierler - Slide 8
71
E194 - Gary Zierler - Slide 9
72
E194 - Gary Zierler - Slide 10
73
E194 - Gary Zierler - Slide 11
74
E194 - Gary Zierler - Slide 12
75
E194 - Gary Zierler - Slide FM1
76
E194 - Gary Zierler - Slide FM2
77
E194 - Gary Zierler - Slide FM3
78
E194 - Rod Lyon - Slide 1
79
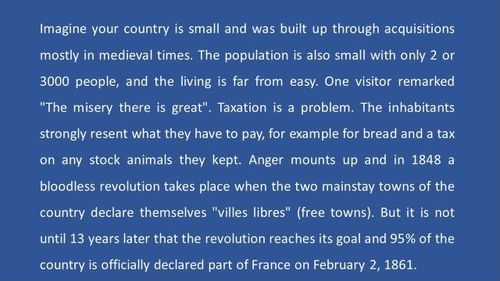
E194 - Rod Lyon - Slide 2
80
E194 - Rod Lyon - Slide 3
81

E194 - Rod Lyon - Slide 4
82
E194 - Rod Lyon - Slide 5
83
E194 - Rod Lyon - Slide 6
84
E194 - Rod Lyon - Slide 7
85
E194 - IMCoS Show & Tell - Questions - November 30, 2021
Place a DOT on the image